


The “Ginfographic” is the result of an annual survey put together by the folks over at GinFoundry. For the last several years these Gin lovers have asked other Gin lovers and novices to share their interests, tastes and habits surrounding Gin. As they admit, the people that take a survey about Gin may be a bit skewed since they likely know more about Gin than the average Joe. But, what they do feel the survey results paint is an honest picture or in this case Infographic of what’s happening in the category.
For the Benefit those Who Drink, Serve and Make Gin
With thousands of respondents to the survey, it’s a broad representation of how the gin category is perceived and which trends are playing out. It shows how people like gin poured, their attitudes towards craft, cost, service and their general consumption. The questions asked, though simple, provide a series of very interesting insights into the state of Gin.
What is Gin?
Here’s the general class definition from the Alcohol and Tobacco Tax and Trade Bureau or TTB.
- Gin (Compounded) is juniper berries and (optionally) other aromatics or their extracts, essences or flavors blended with neutral spirits
- Gin (Distilled) is juniper berries and (optionally) other aromatics or their extracts, essences or flavors added to mash prior to distillation
- Gin (Redistilled) is juniper berries and (optionally) other aromatics or their extracts, essences or flavors added to distilled spirits prior to redistillation
- Gin Liqueur / Cordial – Wine, if used, may not exceed 2½% by volume of the finished product.
Stay Informed: Sign up here for the Distillery Trail free email newsletter and be the first to get all the latest news, trends, job listings and events in your inbox.
Related Stories
The Chemistry Behind the Gin We Love So Much [Infographic]
The History of Gin – Part 1: Conflict and Decadence
The History of Gin – Part 2: The Boom and Drunken Bust
The History of Gin – Part 3: From Debauchery to Modern Day Decadence
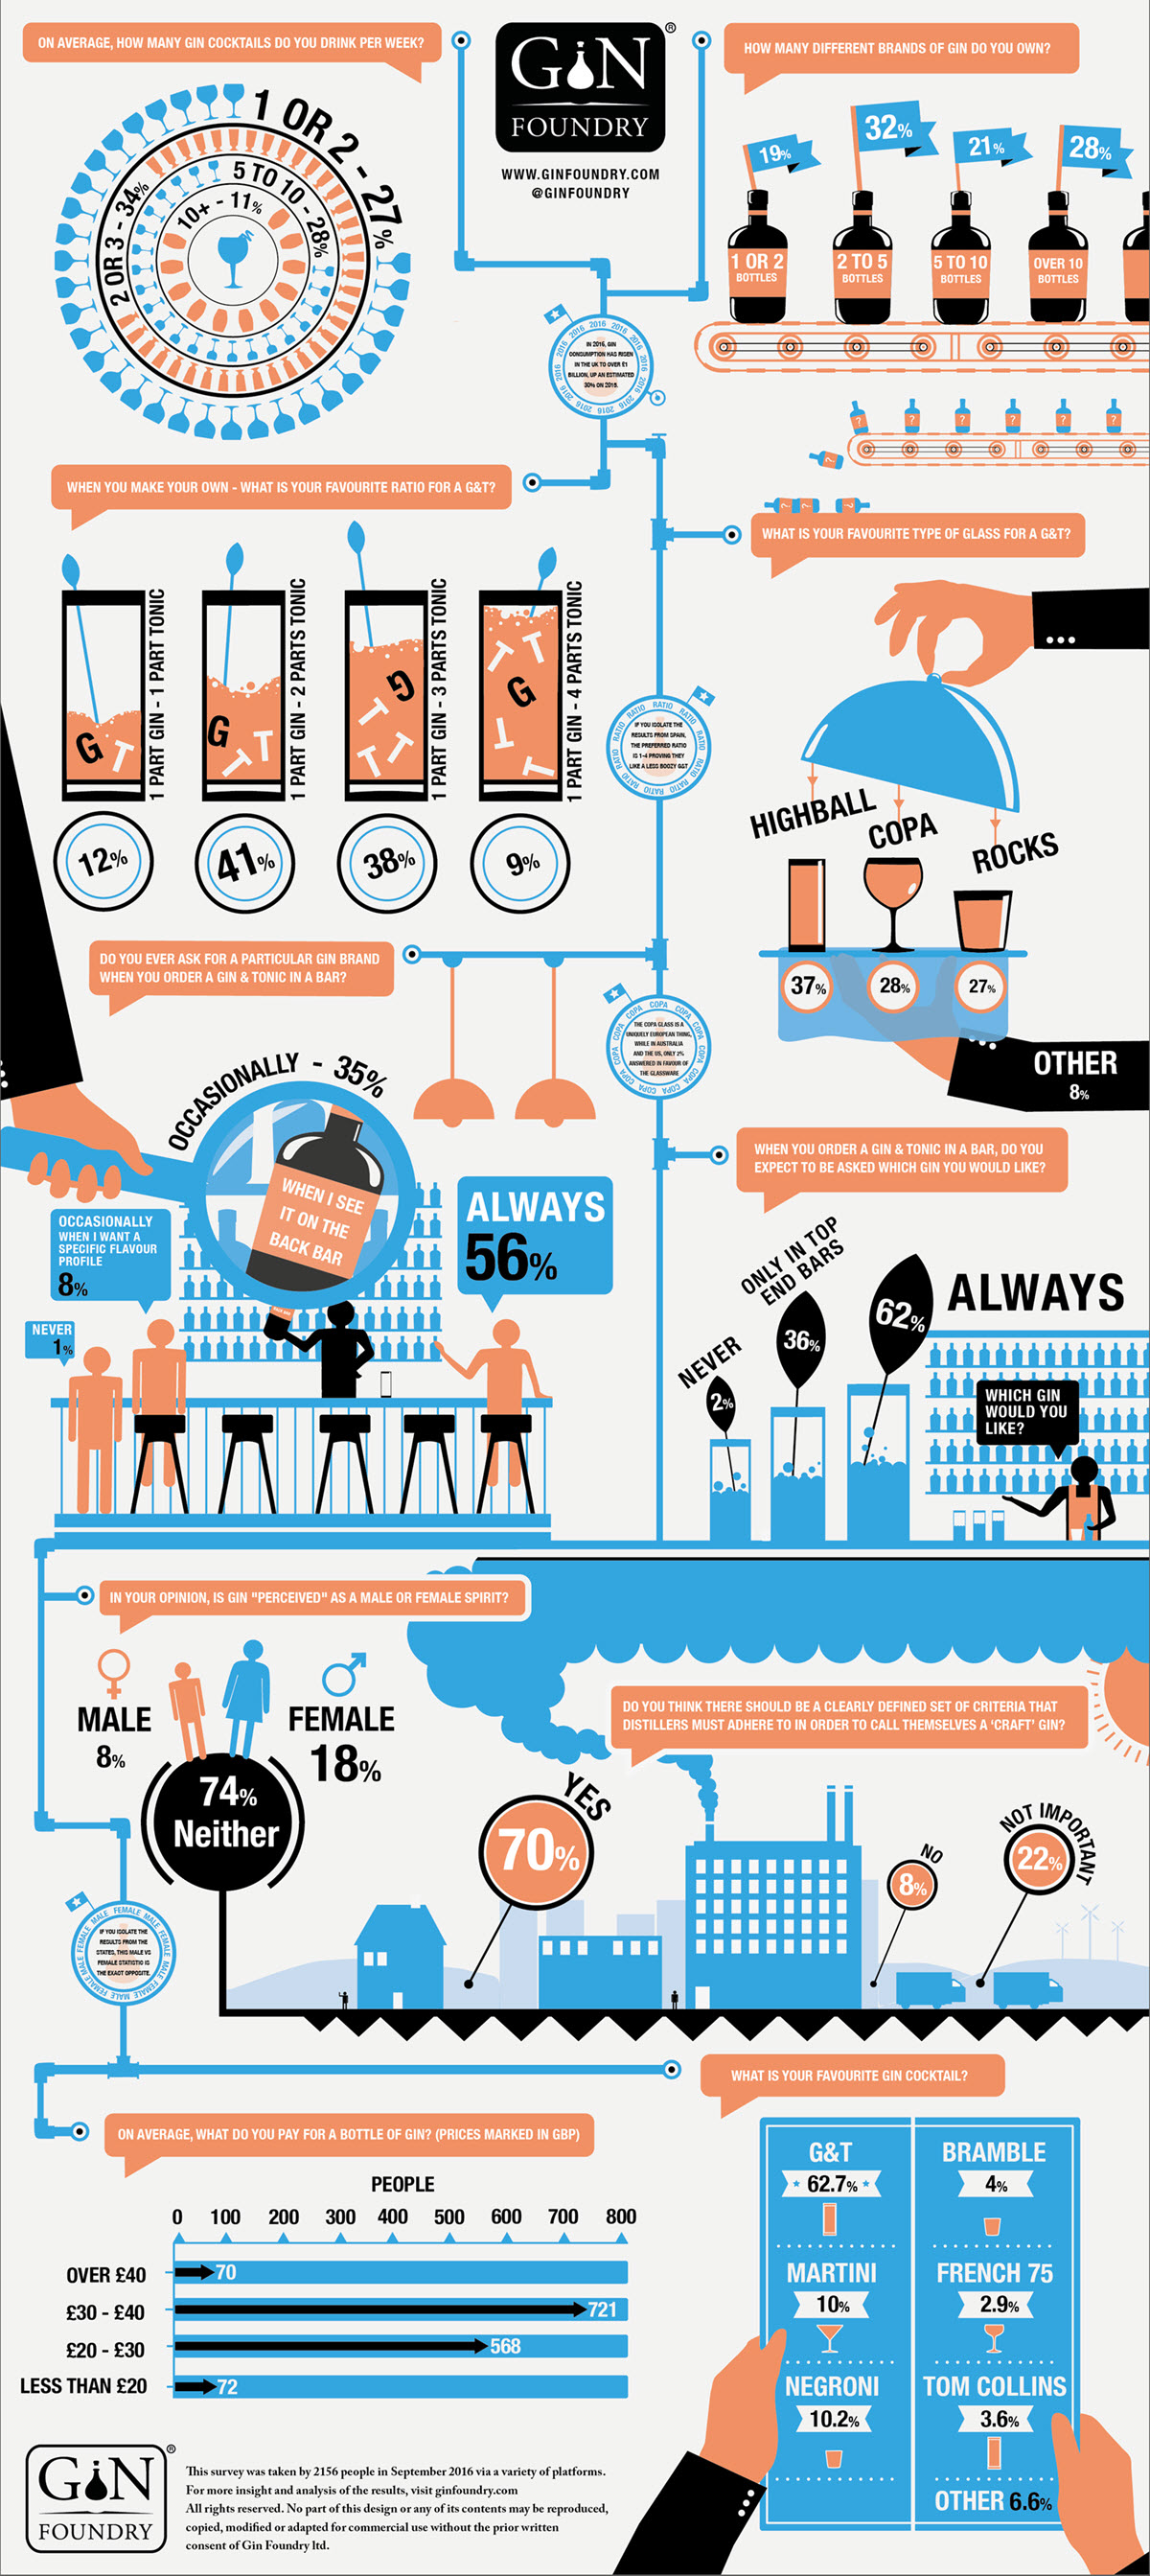
A Few Highlights from the 2016 Ginfographic
- The average number of brands of Gin owned has increased. Likely the result of more craft spirits makers making Gin.
- The Gin ratio to mixers is changing but generally the percent of alcohol is going up. The survey didn’t ask about drinking it Neat but, I suspect as more craft makers enter the market the flavors of the Gin can now stand on their own like never before.
- The favorite glass (or in this case favourite since it’s mainly a European survey) chosen was a COPA glass, a long stem, big bowled balloon shape glass.
- Gin and Tonic remains by far the most common cocktail as chosen by 62.7% of respondents.
- When ordering a Gin cocktail, 56% of respondents always ask for a specific brand. Well drinks simply will not do. Having said that, if you can get your local bar to make your Gin the House Gin, you will see the results help to build your brand and bottom line.
Now pour a glass, sit back and enjoy!
Click on the 2016 Ginfographic below to see it full size.